|
 |
|
|
|||


|
 |
|

Aug. 26, 2024
By Kent Reid, Chief Appraiser, Farm Credit Illinois, Appraisal Services
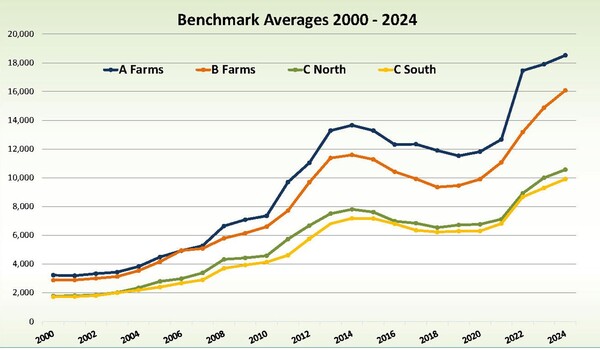
Farmland Average Values Remains Strong in 2024 According to Farm Credit Illinois' annual benchmark study, farmland values in the central and southern 60 counties of Illinois increased for the sixth consecutive year. On average, the benchmarks were up 7.49%. This overall increase measured similarly to 2023 results. As seen in Figure 1, land values had a dramatic run-up beginning in 2003, until peaking in 2014. The first decline in more than a decade began in 2015 and continued a slight decline through 2018. From that point, land values increased again for five consecutive years and set new highs in 2023. Benchmark analysis revealed a statistically stable land market in 2019 with a change of +0.2%. Influenced by strong commodity prices beginning in fall of 2020, land values increased by 2.1% in 2020, 8.5% in 2021, a substantial 27.9% in 2022, and 8.1% in 2023. The 2024 study reflected an average increase of 7.49% with 18 of 22 benchmark farms increasing in value. Results across all land classes showed considerable variation, reinforcing that agricultural real estate is a location-specific asset. When considering the individual benchmark values, the average year-over-year percentage changes across the four land class categories (1A, 2B, 3C Central, and 3C Southern) ranged from +3.6% to +14.05%.
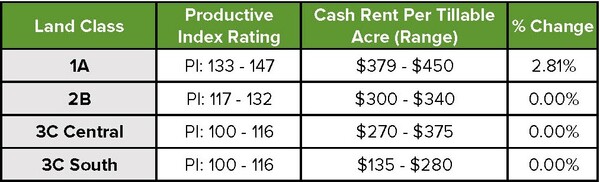
Cash Rental Trends This year's study showed cash rents have mostly stabilized after three years of increases. As illustrated in Table 2, average changes in the four land classes varied. In conducting the benchmark study, the rates used looked at the overall picture from the past year and looks forward into cash rents that will be negotiated this fall. As for next year, we could see a change in cash rents due to lower commodity prices and possible negative net farm income. Overall, cash rents remained stable. Summary The 2024 benchmark update for the Farm Credit Illinois territory shows continued strength in the farmland market. Eighteen of the 22 benchmarks increased in value while four benchmark farms remained unchanged. The variability of increases in the FCI territory reinforce that agricultural land is a location specific asset. The economic health of farmers and farm owners remains stable, but there are still pressures on farmers' financial positions. Interest rates, higher cash rents over the past several years, and lower commodity prices this fall will be a challenge that could affect land values in the upcoming year. Overall, an increase of 7.49% indicates a solid market throughout FCI's 60-county territory. Values as of mid-2024 continue to be at an all-time high. This fall and winter will bring challenges to the market that warrant careful monitoring. To read the entire report click here. Tweet |
|
|
|
|
|
|
|
|
|||||||||||||