|
| CLICK HERE TO VIEW CURRENT ISSUE |
 |
| Best of NAMA 2026 |


|
 |
|
USDA RELEASE MAP SHOWING AG PRODUCTIVITY GROWTH IN THE U.S.
May 12, 2025
Source: USDA news release
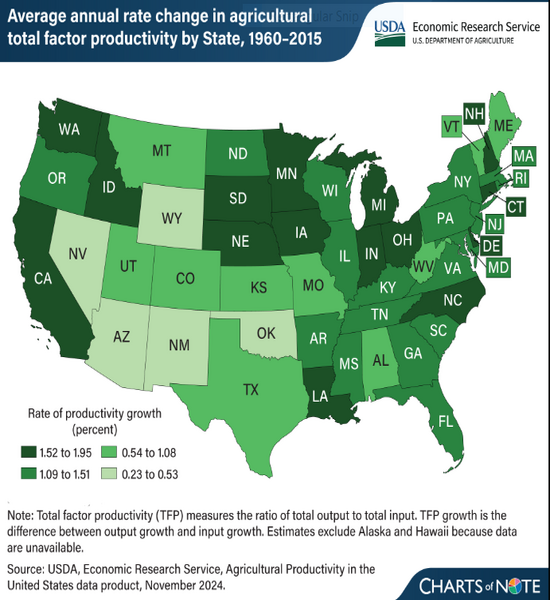
Agricultural productivity grew in every U.S. State from 1960 to 2015, but the growth rates varied widely. The USDA, Economic Research Service (ERS) estimates annual growth and relative levels of agricultural inputs used and outputs produced as well as total factor productivity for the 48 contiguous States.
Total factor productivity measures the amount of agricultural output produced from the combination of land, labor, capital, and material resources employed in farm production. If total output grows faster than total inputs, then total factor productivity increases.
From 1960 to 2015, average annual productivity growth rates ranged from 0.23 percent in New Mexico to 1.95 percent in Ohio. The median total factor productivity growth rate from 1960 to 2015 was 1.34 percent a year.
|
|
|
|
|